- Avalanche (AVAX) price is facing an oncoming period of consolidation as it displays bearish signs. Its decrease in volume indicates increased selling pressure.
Avalanche (AVAX) price has faced brutal downward pressure in the past couple of weeks despite improving fundamentals and overall market conditions.
The price began dropping on July 22 and continued throughout the Bitcoin Conference 2024, which rejuvenated the rest of the crypto market.
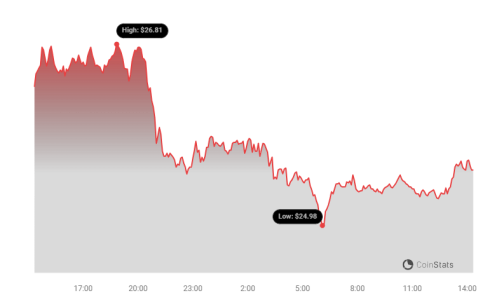
Most recently, the California DMV digitized 42 million car titles on the AVAX C-Chain, firmly cementing Avalanche as an optimal destination chain for RWA protocols. Despite the development, the price of AVAX dropped 3.4% over the last 24 hours to trade at $25.34.

California DMV Digitizes 42 Million Car Log Books on Avalanche
On July 31, President of Ava Labs John Wu announced that the California Department of Motor Vehicles (DMV) had digitized 42 million car log books on the Avalanche C-Chain.
1/8
The @CA_DMV has digitized 42 million titles on the Avalanche blockchain! This is a significant leap forward in modernizing public records and enhancing efficiency for all.
— John Wu
(@John1wu) July 30, 2024
The move is part of an ongoing endeavor to modernize the process of car ownership transfer in the state.
What this means for Avalanche is that adoption is growing, and the RWA tokenization sector is getting actualized on the network.
California, being the 5th largest economy in the world, means this partnership should automatically translate to a higher token price as AVAX is the official gas token of the C-chain.
Nevertheless, Avalanche’s price continued to slide lower, possibly due to a Bitcoin-induced market-wide dip.
Avalanche Price May Drop Further if Sell Pressure Persists
The AVAX price chart shows a downward trend since reaching a high of around $65.39, as indicated by the lower highs and lower lows.
The price consistently trading below the 200-day EMA (black line) and 50-day EMA (green line) also confirms the downtrend.
The chart reveals a head-and-shoulders pattern, with the neckline around the $32.29 level. This pattern is a bearish reversal indicator, suggesting further downside.
The neckline was breached and recently retested. The recent candlestick formation shows indecision, suggesting a potential consolidation phase before the next move.
The current key support level for Avalanche price is around $24, which coincides with previous lows. A break below this would pull AVAX price even lower to $20, a 21% drop from the current price. Conversely, the resistance is around $28.65 (50-day EMA) and $32.29 (200-day EMA).
The daily AVAX trading volume decreased during the slump, signaling weaker selling pressure.
However, the overall bearish trend remains intact, as seen by the negative Chaikin Money Flow (CMF) at -0.07, which suggests outflows of capital. The Relative Strength Index (RSI) is at 40.77, suggesting that the market is not yet in oversold territory but is relatively close.
If the AVAX price breaks above the $32 (200-day EMA) and maintains above it, it would signal market strength, invalidating the head-and-shoulders pattern that supports the bearish thesis and turning the Avalanche price action bullish.
Such a scenario may catapult AVAX to $40, which marks the next major resistance zone.


